
[et_pb_section fb_built=”1″ disabled_on=”off|off|off” _builder_version=”4.3.2″ background_color=”#ffffff” background_enable_image=”off” custom_padding=”51px|||||”][et_pb_row _builder_version=”3.25″ background_size=”initial” background_position=”top_left” background_repeat=”repeat” custom_padding=”99px|||||” custom_margin=”4px|auto||auto||” min_height=”552px”][et_pb_column type=”4_4″ _builder_version=”3.25″ custom_padding=”|||” custom_padding__hover=”|||”][et_pb_text _builder_version=”4.3.2″ background_size=”initial” background_position=”top_left” background_repeat=”repeat” min_height=”196px” custom_margin=”-139px|||||” custom_padding=”||0px|||” hover_enabled=”0″]
A survey is a standardized data-gathering instrument developed to characterize the knowledge, attitudes, and behaviors of a group of people using questions or statements prepared in advance (Kasunic, 2005). In this document, the approach is described as a five-stage process that includes the following steps. (This is a simplified approach developed to meet the needs of DME interns. For more information about the full seven-stage approach, please see Kasuinic, 2005:
- Identify the research objectives.
- Identify and characterize the target audience.
- Design and write the questionnaire.
- Distribute the questionnaire.
- Analyze the results.
[/et_pb_text][et_pb_toggle title=”Characteristics of a Survey” _builder_version=”4.3.2″ hover_enabled=”0″ custom_margin=”-27px|||||”]
Essential components of an effective survey (Kasunic, 2005):
- Systematic: The survey follows a specific set of rules, and there should be a formal and orderly structure.
- Impartial: The survey does not influence the way respondents answer questions.
- Representative: The survey includes questions that are representative of the problem and the population affected by it.
- Theory-based: The survey’s design is guided by relevant theories or principles related to the problem at hand. The survey uses appropriate statistical analyses to interpret the data.
- Quantitative: The survey assigns numerical values to non-numerical characteristics of human behavior that allow for uniform interpretation of these characteristics.
- Replicable: Other people using the same methods in the same ways will get the same results.
[/et_pb_toggle][et_pb_toggle title=”Identify the Research Objectives of the Survey” _builder_version=”4.3.2″]
Successful surveys are a result of planning and carefully defining the problem. It is crucial when designing a survey that you understand the subject in which you are studying. It is common before you create your questions to conduct interviews with subject matter experts to gain knowledge of topics that you are not familiar with (Kasunic, 2005). Once the interviews are complete, you can begin defining the research objectives. The objectives will define the problem and provide guidance and scope for the survey process as it unfolds. During this phase of the design process, you will want to get everyone on the same page about the issue at hand.
Takeaway
The importance of well-defined objectives (stage 1) cannot be overemphasized. A questionnaire that is written without clear objectives will overlook important issues and waste respondents’ time by asking unnecessary questions (Kasunic, 2005)
Questions to Ask When Developing the Objectives
- What do you want the survey to accomplish?
- How will the information from the survey be used?
- What information already exists about the problem about which you are asking questions?
[/et_pb_toggle][et_pb_toggle title=”Design and Write the Survey Questions” _builder_version=”4.3.2″]
This section will detail the design and development of the questionnaire. In this phase, you will be using the objectives and characteristics of the target population to write your questions. It is helpful to know if your survey will be used as an improvement or a measurement tool (Derickson, 2019). Well-defined objectives will make it easier to write the questions, and if you are struggling to write questions, then go back to the objectives phase and spend more time defining the issues that need to be addressed. It is important to know the characteristics of your target population so you can write questions that use familiar language, the appropriate reading level, and avoid technical research words (Kasunic, 2005).
Stages of Design
1. Determine the questions to be asked.
During the objectives phase, the team worked on developing goals for the survey, and during this stage, internal questions will need to be generated. The internal questions are broad, usually open-ended, and complex. It is not necessary at this stage to worry about wording or formatting of the internal questions, but it is important to make sure the questions are clear and align with the objectives.
There are four types of questions you may include in your survey:
- Attributes
- Attribute questions typically ask for information about personal or demographic characteristics. Researchers collect this type of information so they can explore how questions about beliefs, attitudes, and behavior differ for respondents with various attributes.
- Attitudes
- Questions about attitude ask people how they feel about something and require them to indicate whether they have positive or negative feelings about a topic.
- Beliefs
- Belief questions, also referred to as opinion questions, try to determine how people think about a particular subject at a specific time. Belief questions are more focused and specific than attitude questions.
- Behaviors
-
Behavior questions ask respondents to describe what they have done in the past or what they are currently doing. They are typically analyzed in terms of the following:
- whether the behavior is present or absent
- frequency of the behavior
- degree of behavior performance completion
Survey work should be a team approach, and the table below provides a visualization of the process of building your internal questions.
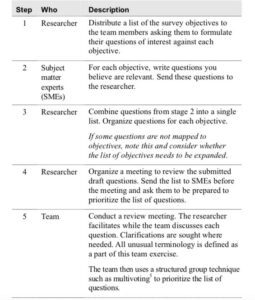
As a result of this substage, the researcher should have a list of prioritized questions that represent the team’s thinking about the information to be sought through the survey.
2. Select the question type/format for each question and specify the wording
During this stage, you will be taking the internal questions generated in stage 1 and using them to develop the items for the questionnaire. The questions must be able to be quantitatively analyzed and understandable to the target audience (Kasunic, 2005). To make an internal question quantitative, you will typically write it into multiple specific close-ended questions. The following factors must also be considered when writing questions:
Structure
There are two options for creating questions:
- Close-ended
- In a close-ended survey the questions provide respondents with a set list of answer choices. This structure is helpful when surveying large populations as well as for ensuring consistency of responses.
- Open-ended
- In an open-ended survey the questions allow the respondent to write in their own answer. This structure is useful when you want respondents to answer a question in narrative-style responses. However, open-ended surveys are also time-consuming to analyze and not suitable for large populations.
Wording
It is important to choose your wording carefully to ensure construct validity. Construct validity is the degree to which a test measures what it claims to be measuring. Respondents must understand the question, be capable of providing the information requested, and be willing to provide the information requested (Kasunic, 2005).
Here are some helpful questions to ask when writing the questions:
- Will the words be uniformly understood?
- You want the question to mean the same thing to all respondents.
- Do the questions use unconventional terminology, phrases, or abbreviations?
- You want to avoid technical language and abbreviations.
- Are the questions too cryptic, vague, or precise?
- Questions that are too vague will cause respondents to interpret the meaning of the question. Questions that are too precise may rule out important information you may want to capture.
- Is the question biased?
- Avoid phrasing questions in a way that suggests certain answers are more acceptable than others.
- Is the question objectionable?
- Avoid asking questions that are too personal or may incriminate a respondent.
- Is the question too demanding?
- Avoid writing questions that are too mentally demanding. Mentally demanding questions are typically hard to understand.
- Is it a compound question?
- Avoid asking more than one question in a single item.
- Does the question include a double negative?
- It can be confusing and easily misinterpreted.
- Are the answer choices mutually exclusive and exhaustive?
- Example: How many years of experience do you have?
a. 0-3
b. 3-5
c. 5-7
d. 7+
In this example, you can see that these responses are not mutually exclusive. - Have you assumed too much about respondent knowledge or behavior?
- Provide an “I don’t know” option when needed.
3. Design the question sequence and overall questionnaire layout.
At this point in the survey development process, you should have a list of questions that you believe address the research objectives of the survey. But there is still more work to do before your questionnaire is complete and ready to be tested and distributed to your target audience (Kasunic, 2005).
To complete the survey questionnaire, you will need to consider the following:
- Length of the questionnaire
- Lengthy surveys have a significantly lower response rate. To help make sure your survey is not too long, you must prioritize your questions. Ask your subject matter experts to rank questions like: 1) Must know, 2) Useful to know, and 3) Nice to know.
- Organization of the questionnaire
- You should group questions according to the topic so that your questionnaire has a logical flow. Start your survey off with demographic questions so that respondents will become engaged. Transition to substance questions and place the close-ended questions before any open-ended items.
- Instructions
- Self-administered surveys need to have clear and well-written instructions so that respondents will know how to answer the question. Never assume that the target population will know how to respond.
4. Develop support documents.
This stage discusses the development of materials that will help with implementation of the questionnaire.
A pre-notification letter (or email) will alert respondents that an upcoming survey will be distributed. Researchers have found this helps increase the response rates.
Also, you must write an introduction page for your survey that covers the following:
- The purpose of the survey
- The organization or individuals sponsoring the survey
- Encouragement and/or incentives to participate
- Anonymity or confidentiality (i.e. assurance that the respondents and their responses will not be revealed, but only combined with many other responses to learn about overall opinions)
- A list of the sections included in the questionnaire
- An explanation of how the results will be published and how the results will be used
- An estimate of how long it will take to complete the questionnaire (Kasunic, 2005).
You may also want to send out reminders to the target population to complete the survey. At the end of the survey, you will also include a thank you page to show appreciation to the respondents for taking the time to complete your survey.
Questions to ask when designing the questionnaire:
- How will the survey be mediated (e.g., via paper, email soft copy, web)?
- How long should the questionnaire be?
- How should the questionnaire be structured and organized?
- What page design and formatting will be most effective?
- What other documents might promote survey effectiveness?
[/et_pb_toggle][et_pb_toggle title=”Distribute the Questionnaire” _builder_version=”4.3.2″]
At this phase, your questionnaire is written, and you may want to pilot test the survey with your subject matter experts so that they may provide any feedback or revisions before the survey becomes public (Kasunic, 2005).
During this time, it is also helpful to make sure the pre-notification email was sent to the target population so that they are prepared to take the survey when they receive it.
The questionnaire should be distributed to selected members of the target audience.
[/et_pb_toggle][et_pb_toggle title=”Analyze Results” _builder_version=”4.3.2″]
In this phase, you will need to export your data from whatever survey software you used to distribute the questionnaire (i.e., Qualtrics, Survey Monkey, etc.) to spreadsheet programs or specialized statistical packages. Once you have moved your data to one of these programs, it is necessary to code your data. Text responses are coded to ease data entry, facilitate data manipulation, and allow quantitative analysis. There are various ways to assign numbers to questionnaire answer choices. The way numbers are assigned matters because the type of assignment determines the type of measurement analysis that can be undertaken (Kasunic, 2005).
The assignment types are classified in terms of the level of measurement used in a question’s answer format. They are the following:
- Nominal
- In a nominal response format, the numbers used have no meaning except as a placeholder for the text response. The numbers represent categories.
- Ordinal
- An ordinal response format asks respondents to rank-order their preferences in list. Measurements with ordinal scales are ordered in the sense that each number has a value in relation to the other. Likert scales are an example.
- Interval
- With interval numbers, the distance between attributes does have meaning (although the scale does not possess an absolute zero point).
- Ratio
- Ratio-type response information can be averaged and formed into ratios. With ratio numbers, there is an absolute zero.
Once the data has been organized appropriately, statistical analysis can be conducted. Statistical analysis for survey data examines response patterns—frequencies of different responses, what response occurred most frequently for each question within a group, variation in responses within a group, and differences in ways different subgroups (within the same survey) responded.
The results should be collected and translated into appropriate graphical displays that facilitate understanding. The charts can be compiled into a report and interpretations, inferences, generalizations, and caveats can be made based on evidence provided by the results.
Once the results are finalized, it is recommended to share the results with employees (or interns) of the organization so that they know what their responses contributed to (Derickson et al., 2019).
[/et_pb_toggle][et_pb_toggle title=”References” _builder_version=”4.3.2″]
Derickson, R., Yanchus, N. J., Bashore, D., & Osatuke, K. (2019). Collecting and Reporting Employee Feedback for Large Organizations: Tips from the Department of Veterans Affairs. The Psychologist-Manager Journal, 22(2), 74.
Kasunic, M. (2005). Designing an Effective Survey (No. CMU/SEI-2005-HB-004). Carnegie-Mellon Univ Pittsburgh PA Software Engineering Inst.
[/et_pb_toggle][et_pb_text _builder_version=”4.3.2″]
Interested in joining the DME Interns team? Click here to find out more and sign up to be notified when applications open!
[/et_pb_text][/et_pb_column][/et_pb_row][/et_pb_section]